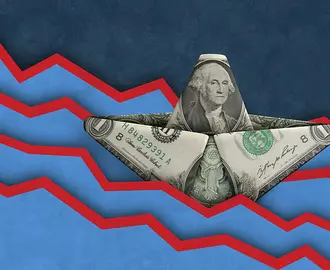

This new business index offers a more accurate way to forecast recessions
Unlike existing forecasting approaches that are subjective, the new index relies solely on data to make its recession prediction.
Even before coronavirus fears sent the markets into a tailspin, the United States was already in danger of a recession. That’s according to a new business index developed by an MIT Sloan researcher and others that relies solely on data to predict market behaviors.
The new approach relies on a mathematical principle to measure the statistical similarity of current economic conditions to past episodes of recession and robust growth. In doing so, the research, released in January 2020, had uncovered a 70% chance of recession in the following six months.
“What I was most surprised about in the research is how tightly the forecasts throughout history lined up with the actual incidence of recession during the next six months,” said a senior lecturer at MIT Sloan and one of the authors of “A New Index of the Business Cycle.” “Working in finance and economics for so many years, it’s seldom that you see that tight of a fit. The correlation was 99%.”
In their analysis, the authors examined historical data between 1916 and 2019 for the following economic variables: industrial production, nonfarm payrolls, stock market return, and the slope of the yield curve. Their intent was to cull valuable insights from extreme highs and lows in the economy (known as “tails”) as opposed to times when the economy is chugging along per the usual.
“There’s more information during periods when there’s recession or periods when there’s robust growth than there is when the economy’s growing at a normal pace,” said Kritzman, who is also the president and CEO of Windham Capital Management.
The study — based on data leading up to November 2019 and conducted by Kritzman and co-authors William Kinlaw and David Turkington, both of State Street Associates — used a formula called the Mahalanobis distance to measure current economic conditions to previous episodes of robust growth and recession. “It surprised me how well it worked historically,” Kritzman said. “It was much more reliable than the inverted yield curve, which pundits give so much credence to.”
A reliable indicator of recession
The Mahalanobis distance statistic was introduced in 1927 and modified in 1936 to analyze resemblances in human skulls among castes in India. Since then, it’s been used to measure turbulence in the financial markets, diagnose disease, and detect anomalies in self-driving vehicles.
Kritzman and his coauthors had the idea to use the formula to assign numerical probabilities to economic scenarios, as outlined in previous research he worked on entitled “Enhanced Scenario Analysis.”
“The entire process of scenario analysis is reasonably scientific — except for the part where we have to assign probabilities,” said Kritzman. “That usually happens around a conference room table, and it’s very subjective. What we wanted to do was to come up with a more empirically driven scientific approach to assigning these probabilities.”
Kritzman said the new index of the business cycle is a reliable indicator because it examines historical periods of recession and robust growth, where there’s plenty of valuable information to pull from. In addition, the index explicitly accounts for the interaction of the four economic variables from which it is constructed (industrial production, nonfarm payrolls, stock market return, and the slope of the yield curve).
“We look at [the variables] by themselves, but we also take into account how they co-move with each other,” Kritzman said. For example, having two variables diverge both historically and in the present day amplifies the possibility that present conditions mirror the historical ones. “The divergence of these variables might tell us a lot about the economy, and that’s not captured in the other approaches that are out there.”
An objective, data-driven approach
Given that the index is strictly data-driven and unaffected by human bias or persuasion, Kritzman said it gives an objective assessment of the business cycle, along with the fact that the index is constructed from variables that are different from those used both by the National Bureau of Economics Research and The Conference Board to identify recessions.
“There’s huge overlap between the variables that the NBER looks at and the variables that The Conference Board looks at,” Kritzman said, noting that the Conference Board’s prediction “effectively becomes a self-fulfilling prophecy.”
“The variables that we use, except for one, do not overlap with the variables that the National Bureau of Economics Research uses to identify recessions, so it has more independence that way,” he said. “And our index is purely driven by the data. There’s no subjective input into whether or not we’re in recession. We just let the numbers speak for themselves.”