

Try this data framework for analytics advantage
Finding the right data, cleaning it, and shaping it so that it meets your needs is a skill. Here are seven pro tips to get the job done right.
Data has the power to help drive efficiencies, increase profitability, and bolster innovation.
Yet analytics skills remain outside the wheelhouse of most business leaders, who typically have little experience interpreting data from multiple sources or identifying what data sources are necessary to formulate the insights they are seeking.
Shoring up this experience gap among leadership can make all the difference in turning data-driven business aspirations into tangible and decisive actions.
With that goal in mind,the associate dean of business analytics at MIT Sloan, has developed an approach to help nontechnical business users gain confidence using data to improve their decision-making.
In his online course for executives titled Applied Business Analytics, Bertsimas, a professor of operations research, lays out an analytics framework that is designed to help businesspeople determine which analytics approach is best suited for their application and improve their ability to leverage big data for better business outcomes.
The framework is built upon data, models, decisions, and value, with an emphasis on decision-making. “The two protagonists in this process are data and decisions,” Bertsimas says in the introduction to the course. “Analytics leaders may understand the basics of the modeling, but it is their skillful handling of the data and the decisions that gives them an edge.”
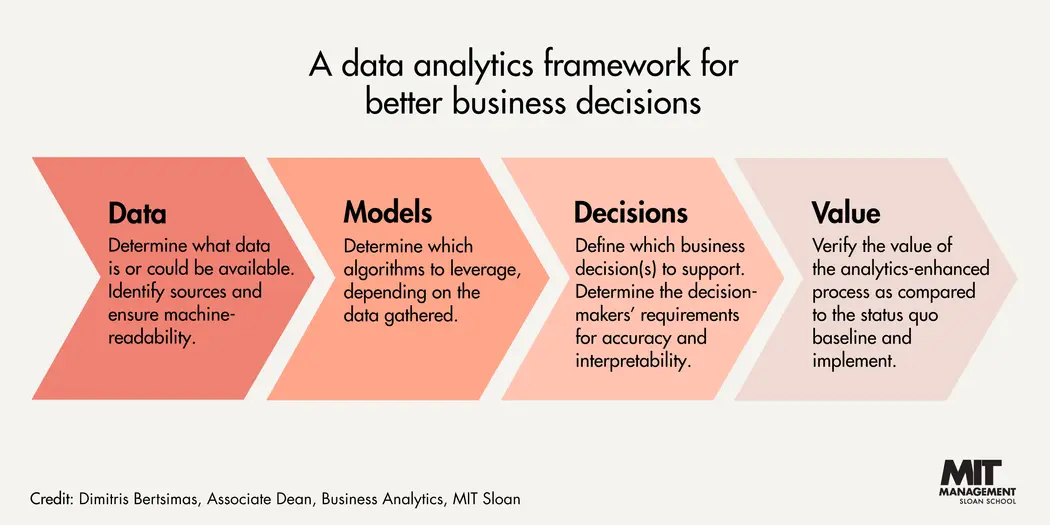
The framework at a glance
The framework begins with data, which Bertsimas calls “the most important aspect” of analytics. “Finding the right data, cleaning it, and shaping it so that it works toward your need is a skill that takes experience and understanding,” he says.
Next, organizations use the data they have gathered to decide which models to use; the outcome of those models influences decisions around onboarding a data team, choosing the best tools, selecting the right variables, and outputting effective visuals — all of which should ultimately result in value to the organization.
As an example, here’s how the data analytics framework would look when used by an equity firm — let’s call it Acme Equity — planning to make a large investment in a growth firm it has identified. Elements would include:
Data. Acme Equity needs to collect relevant data on the earnings of the target firm, including the consistency, repeatability, and quality of the earnings.
Models. To understand how those earnings may grow, Acme needs to develop a predictive model that encapsulates all factors affecting earnings and considers past situations. There’s also the question of choosing the appropriate model, which in this scenario could be linear regression, a machine-learning tree-based model, or others.
Decisions. This stage is all about evaluating risk and making informed decisions based on the outcomes from various models, which should be able to predict the drivers that will lead to high or low revenue.
Value. By this stage, Acme Equity should be able to set clear expectations about the potential value of investing in its target company, including the level of return from a potential investment and the ability to maintain a relatively low risk profile.
Three types of algorithms
Central to any business analytics initiative are algorithms, which Bertsimas defines as “a set of guidelines that describe how to perform a particular task.”
For business leaders still struggling to separate logistic regression from integer optimization (both covered in the class), it’s beneficial to think of algorithmic options as three buckets:
- Descriptive — for identifying patterns or converting images and text to numbers. A descriptive algorithm might be used to group movies by genre and create a personalized movie recommendation engine — an approach popularized by Netflix.
- Predictive — for forecasting outcomes, such as whether a person is likely to default on a loan or how many games a baseball team will win in the next season.
- Prescriptive — for recommending next steps, such as suggesting a particular insurance policy or investment selection.
Determining which algorithm is the best fit requires an understanding of the type of data and how it’s organized, Bertsimas says.
Structured data is organized in rows and columns, where rows represent data points and columns represent a variable/feature of the data. Unstructured data is any data not organized in that way — for example, voice, video, text, or tweets.
Related Articles
Unstructured data eventually needs to be converted to structured data to ensure a complete and integrated data set — a task that is much on business leaders’ minds. According to analytics management firm Komprise, 87% of IT leaders surveyed in 2022 said managing unstructured data growth is a top priority, up from 70% the year previous.
Pro tips for analytics success
Data analytics is a complex and highly specialized endeavor. But with a pragmatic approach, the practice is accessible to more business users, enabling companies of all stripes to reap the rewards of data-driven decision-making.
Setting an objective and mapping a problem statement to the framework are important first steps, Bertsimas says, but equally important is identifying both roadblocks and unanticipated opportunities, and planning for those.
To that end, Bertsimas enlisted the help ofpreviously an engagement manager at McKinsey and now a lecturer in operations research and statistics at MIT Sloan, to develop a series of pro tips gleaned from real-world experience.
Among the tips for rolling out an analytics project:
Foster stakeholder agreement. Leveraging analytics to solve complex business problems necessitates some assumptions. But it’s also important to ensure that all stakeholders are aligned on a methodology that comprises inclusion and exclusion criteria governing data and models. If stakeholders don’t agree on the basics, they aren’t likely to accept the recommendations of the analysis, and the effort is for naught.
Enlist the right leader. An analytics leader with political capital can ensure more effective collaboration between junior tech talent and domain experts. The right leader will engage the appropriate subject matter experts to determine what data will be most useful and coach teams to build trust. Ultimately, the choice of leader will help accelerate time to value for analytics efforts and shorten model production cycles.
Determine the appropriate data set and size. Data sets can come from numerous places, including data markets, public records, known databases, and self-generated data, as well as the API economy. Analytics leaders should work with both subject matter experts and data scientists to determine the appropriate data sources, along with the right training set and test set data size. Typically, the range for the training set is between 50% and 80% of data, although larger data sets require less data for training models and more for testing. One important rule of thumb: Consider how often your model should be refitted to respond to changes over time.
Never assume that a data set is accurate. It’s important to invest time up front to make a data set readable. Eliminate messy formatting, inconsistent terminology, and the use of abbreviations. Ask for summary tables and univariate visualizations to ensure that the raw data makes sense. A rookie mistake is failing to plan enough time for this phase; a conservative estimate is that 60% to 80% of time spent on a data analytics project will be devoted to acquiring and cleaning up data. It’s also important to make time for data inspection, as it helps teams gain a better understanding of model accuracy.
Consider data security ramifications. Often, when you buy data, it’s been sanitized to exclude personally identifiable information such as Social Security numbers, email addresses, or bank account numbers. Make sure legal counsel is involved if you are negotiating to acquire data that does include PII.
Establish a model baseline. It’s important to have a baseline to compare against more sophisticated models to help determine whether more data, effort, financial investment, or computational power is required to improve predictions. It’s common to see diminishing returns on model improvement in relation to complexity; it’s also common to encounter issues that make the model less useful when applying it to new data.
Don’t reinvent the wheel. There are software packages available that will take a data set from sparse to dense, which can free up the data science team to focus on other tasks. Spend time exploring the optimization and open-source community to find available packages that can be tapped for broader use so the team doesn’t have to create everything from scratch.
Read next: How to build an effective analytics practice: 7 insights from MIT experts